Minnesota Homes Today Local & National News

  • Home
  • About Us
  • Blog
  • Resources
    • Buyers Guide
    • Sellers Guide
    • Buyer Info
    • Seller Info
    • Closing Costs
    • Home Appraisal
    • Home Inspection
    • Loan Checklist
    • Loan Process
    • Loan Programs
  • Contact

Pending Home Sales Index Slips For 4th Straight Month

October 28, 2011 by Bob Elliot Leave a Comment

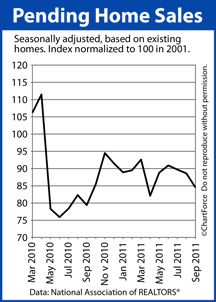
Pending Home SalesNationwide, fewer homes are going under contract to sell.

According to the National Association of REALTORS®, the Pending Home Sales Index fell 5 percent last month. September marks the fourth consecutive month in which the index has dropped. 

The Pending Home Sales Index is a monthly index which measures the number of homes under contract to sell, but not yet closed. As such, it’s among the few “forward-looking” housing indicators; a data set meant to predict future home sales. 

80% of homes under contract close within 2 months so, if the September Pending Home Sales Index is to be believed, we should expect home sales to decline through October and November. 

And that’s before we account for cancelled contracts.

Also from the National Association of REALTORS®, we learn that 18 percent of homes under contract failed to close in September. This is double the failure rate from September 2010 and it, too, should drag Existing Home Sales volume lower this fall.

On a seasonally-adjusted, regional basis, the Pending Home Sales Index fell everywhere. 

  • Northeast Region: -4.7% from August
  • Midwest Region : -6.2% from August
  • South Region : -5.5% from August
  • West Region : -2.1% from August

For home buyers and sellers in Minneapolis and St Paul , though, regional data remains too broad to be useful. Housing markets are local, meaning that each block on each street on each city has its own distinct economy. When 9 states are grouped into a single “region”, it’s neither helpful nor relevant to people making buy/sell decisions.

That said, the Pending Home Sales Index remains important because it’s about housing, and housing is a keystone of the U.S. economic recovery.

The market looks ideal for buyers. Home prices are rising, but slowly; and mortgage rates remain near rock-bottom levels. Home affordability is high and should remain that way for the next few weeks.

If you’re shopping for a home, it’s an excellent time to go under contract.

Filed Under: Housing Analysis Tagged With: Existing Home Sales, NAR, Pending Home Sales

New Home Inventory Keeps Sinking

October 27, 2011 by Bob Elliot Leave a Comment

New Home Supply Sep 2010 - 2011Home builders continue to sell homes and work through inventory.

According to data from the Census Bureau, the number of new homes sold in September jumped 6 percent from the month prior, beating analyst expectations. On a seasonally-adjusted, annualized basis, buyers in Minnesota and nationwide closed on 313,000 newly-built homes last month.

It’s the highest reading since April and a major reason why the available number of new homes for sale is shrinking. 

As compared to September 2010, there are 19% fewer homes for sale nationwide. At today’s sales pace, the complete new home inventory would be “sold out” in 6.2 months – the quickest sell-out pace since the April 2010 federal home buyer tax credit expiration.

It’s no wonder builder confidence is rising.

After averaging 15 through the first 9 months of the year, homebuilder confidence jumped 4 points for October, carried by low mortgage rates and the expectation for a strong winter/spring selling season.

For buyers in Minneapolis and St Paul , this could be construed as a housing market-shifting signal. As builder confidence rises, it becomes more difficult to negotiate for upgrades and price reductions on a new home. “Great deals” get scarce.

Furthermore, it’s unlikely that mortgage rates will sustain their current, ultra-low levels into 2012. Rising rates lead to higher housing payments on a month-to-month basis. 

If you’re in the market for a newly-built home, in other words, today’s homes may represent your best value of the year.

Filed Under: Housing Analysis Tagged With: Census Bureau, New Home Sales, New Home Supply

Detroit Leads All Case-Shiller Cities In Home Price Improvement

October 26, 2011 by Bob Elliot Leave a Comment

Case-Shiller Annual Changes August 2011

The August 2011 Case-Shiller Index was released this week. On an monthly basis, 10 of 20 tracked markets worsened. On an annual basis, valuation degradation was worse.

Only Detroit and Washington, D.C. posted higher home values in August 2011 as compared to August 2010, rising 2.7% and 0.3%, respectively.

However, the index has been moving in the right direction. Since bottoming out in March of this year, the Case-Shiller Index is up nearly 4 percent.

As home buyers and sellers in St Paul , though, we have to remember that the Case-Shiller Index is a flawed product; its methodology too narrow to be the final word for housing markets.

The Case-Shiller Index has 3 main flaws.

The first Case-Shiller Index flaw is its relatively small sample size. Although it’s positioned as a national housing index, Case-Shiller data represents just 20 cities nationwide, and they’re not even the 20 most populous U.S. cities. For example, cities like Houston (#4), Philadelphia (#5), San Antonio (#7) and San Jose (#10) are excluded from the Case-Shiller Index findings.

By contrast, Minneapolis (#48) and Tampa (#55) make the list.

A second Case-Shiller Index flaw is the way in which it measures home price changes. The Case-Shiller Index formula ignores all home sales except for “repeat sales” of the same home. New homes don’t count for the Case-Shiller Index. Furthermore, the index ignores condominium and multi-family home sales, too. 

In some cities, condos can account for a large percentage of sales.

And the third Case-Shiller Index flaw is that the data is reported on a 2-month lag. Next week marks the start of November, yet we’re still discussing data from August. A lot can change in two months (and it often does). Today’s market conditions are similar to — but not the same as — market conditions from before Labor Day.

The Case-Shiller Index is far from “real-time”.

As a monthly release, the Case-Shiller Index does more to help people with a long-term view of housing, including politicians and economists, than it does for everyday buyers and sellers who negotiate prices based on current demand and supply.

I can tell you which homes have sold in the last 7 days, and at what prices. The Case-Shiller Index cannot.

Filed Under: Housing Analysis Tagged With: Case-Shiller Index, Home Values, Standard & Poors

  • « Previous Page
  • 1
  • …
  • 1009
  • 1010
  • 1011
  • 1012
  • 1013
  • …
  • 1133
  • Next Page »

Connect with Me!

Let’s Keep In Touch!

  • This field is for validation purposes and should be left unchanged.

Quick Links

  • About Me
  • Accessibility Statement
  • Blog
  • Contact

Looking For Something?

Categories

Copyright © 2025 · Powered by MySMARTblog

Copyright © 2025 · Genesis Sample Theme on Genesis Framework · WordPress · Log in