Minnesota Homes Today Local & National News

  • Home
  • About Us
  • Blog
  • Resources
    • Buyers Guide
    • Sellers Guide
    • Buyer Info
    • Seller Info
    • Closing Costs
    • Home Appraisal
    • Home Inspection
    • Loan Checklist
    • Loan Process
    • Loan Programs
  • Contact

Home Affordability Still Soaring; New Records Reached

May 27, 2011 by Bob Elliot Leave a Comment

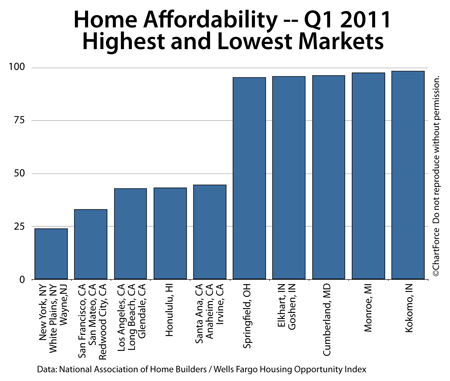
Home Affordability Q1 2011

Home affordability moved higher last quarter, buoyed by stable mortgage rates and falling home prices in Minnesota and nationwide. The National Association of Home Builders reports that Q1 2011 Home Opportunity Index reached an all-time high for the second straight quarter last quarter.

Nearly 3 of 4 homes sold between January-March 2011 were affordable to households earning the national median income of $64,400. It’s the 9th straight quarter in which home affordability surpassed 70 percent, and the highest reading in more than 20 years of record-keeping.

From metropolitan area-to-metropolitan area, though, affordability varied.

In the Midwest, for example, affordability was high. 7 of the 10 most affordable markets were in the Midwest, including Kokomo, Indiana, in which 98.6% of homes were affordable to median income-earning families. Indianapolis, Indiana placed second for “big city” affordability.

The most affordable “big city” last quarter was Syracuse, New York. With a 94.5% affordability rate, Syracuse ranks 8th nationally in the Home Opportunity Index. It’s the second time that Syracuse placed first in the last 4 quarters.

Meanwhile, on the opposite end of home affordability, the “Least Affordable Major City” title went to the New York-White Plains, NY-Wayne, NJ area for the 12th consecutive quarter. Just 24.1 percent of homes were affordable to households earning the area median income, down more than 1 percent from the last reading.

Regardless of where you live, remember that rising mortgage rates can levy more pain on your household budget than can rising home values. And mortgage rates are expected to rise long before home prices do.

The rankings for all 225 metro areas are available for download on the NAHB website.
Filed Under: Housing Analysis Tagged With: Home Affordability, Home Opportunity Index, NAHB

Check Out Your Neighborhood Sold Home Addresses and Details Reports!

May 27, 2011 by Bob Elliot Leave a Comment

Home buyers, sellers, and investors will find valuable information in the details of each city MLS sold home report!

Apple Valley MLS SF Sold Homes April 2011

Bloomington MLS SF Sold Homes April 2011

Brooklyn Center MLS SF Sold Homes April 2011

Brooklyn Park MLS SF Sold Homes April 2011

Burnsville MLS Sf Sold Homes April 2011

Chanhassen MLS SF Sold Homes April 2011

Chaska MLS SF Sold Homes April 2011

Eagan MLS Sf Sold Homes April 2011

Eden Prarie MLS SF Sold Homes April 2011

Edina MLS SF Sold Homes April 2011

Farmington MLS SF Sold Homes April 2011

Golden Valley MLS SF Sold Homes April 2011

Inver Grove MLS SF Sold Homes April 2011

Lakeville MLS SF Sold Homes April 2011

Maple Grove MLS SF Sold Homes April 2011

Maplewood MLS SF Sold Homes April 2011

Mendota Heights MLS SF Sold Homes April 2011

Mpls Calhoun Isle Area MLS SF Sold Homes April 2011

Mpls Central Area MLS SF Sold Home April 2011

Mpls Longfellow Area MLS SF Sold Homes April 2011

Mpls Nokomis Area MLS SF Sold Homes April 2011

Mpls North Area MLS SF Sold Homes April 2011

Mpls Southwest MLS SF Sold Homes April 2011

Mpls University Area MLS SF Sold Homes April 2011

Minnetonka MLS SF Sold Homes April 2011

Plymouth MLS SF Sold Homes April 2011

Prior Lake MLS SF Sold Homes April 2011

Richfield MLS SF Sold Homes April 2011

Rosemount MLS SF Sold Homes April 2011

Roseville MLS SF Sold Homes April 2011

Savage MLS SF Sold Homes April 2011

Shakopee MLS SF Sold Homes April 2011

St Louis Park MLS SF Sold Homes April 2011

St Paul Central Area MLS SF Sold Homes April 2011

St Paul Como Area MLS SF Sold Homes April 2011

St Paul Crocus Hill Area MLS SF old Homes April 2011

St Paul Highland Area MLS SF Sold Homes April 2011

St Paul Home Croft Area MLS SF Sold Homes April 2011

St Paul Mac Groveland River Road Area MLS SF Sold Homes April 2011

St Paul Phalen Area MLS SF Sold Homes April 2011

St Paul Riverview Cherokee Area MLS SF Sold Homes April 2011

St Paul St Anthony Midway Area MLS SF Sold Homes April 2011

St Paul Town and Country Merriam Park Area MLS SF Sold Homes April 2011

Wayzata MLS SF Sold Homes April 2011

White Bear Lake MLs SF Sold Homes April 2011

Woodbury MLS SF Sold Homes April 2011

* If you don’t see the city, or area, you are interested in email me bob@minnesotahomestoday.com and I will send you the results for that city.

Filed Under: Neighborhood Reports Tagged With: neighborhood sold homes reports

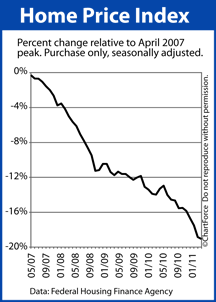
Home Price Index Shows Values Down 19 Percent From Peak

May 26, 2011 by Bob Elliot Leave a Comment

HPI delta from peakHome values dropped for the sixth straight month in March 2011, according to the Federal Home Finance Agency’s Home Price Index. The Home Price Index is a government-sponsored home value tracker.

The HPI report is the latest in a string of “falling home values” stories — a trend that’s troubling home sellers across Minneapolis and nationwide.

However, although the Home Price Index says home values are falling, that doesn’t necessarily mean that they are. Like most statistics in the housing sector, the Home Price Index is plagued by poor methodologies and a lack of timeliness.

In short, the Home Price Index is flawed. In three ways.

The first big flaw in the Home Price Index is that it only measures the values of homes with mortgages backed by Fannie Mae or Freddie Mac. Homes financed via FHA, or via other means are specifically excluded from the calculation. For today’s purchase market, that leaves more than 1 in 4 homes “uncounted” — a big percentage of the market.

Second, the Home Price Index determines home values by measuring price change from sale to subsequent sale. This eliminates new homes — a major market segment.

And, lastly, the Home Price Index reports on a 60-day delay; we’re only now seeing data from March. This two-month lag renders the HPI a trailing indicator for the housing market instead of a forward-looking one. If you’re a home buyer looking for market insight, the HPI can’t give it — it’s out-dated and out of season.

Despite its shortcomings, though, we can’t ignore the Home Price Index completely. It’s among the most thorough home valuation models available, and it’s used in public policy discussions. When the HPI says prices are down, Wall Street and Capitol Hill take notice, and that trickles down to everyday life on Main Street.

Since peaking in April 2007, the Home Price Index is off 19.1 percent.

Filed Under: Housing Analysis Tagged With: Home Price Index, Home Price values, HPI

  • « Previous Page
  • 1
  • …
  • 1087
  • 1088
  • 1089
  • 1090
  • 1091
  • …
  • 1133
  • Next Page »

Connect with Me!

Let’s Keep In Touch!

  • This field is for validation purposes and should be left unchanged.

Quick Links

  • About Me
  • Accessibility Statement
  • Blog
  • Contact

Looking For Something?

Categories

Copyright © 2025 · Powered by MySMARTblog

Copyright © 2025 · Genesis Sample Theme on Genesis Framework · WordPress · Log in