Minnesota Homes Today Local & National News

  • Home
  • About Us
  • Blog
  • Resources
    • Buyers Guide
    • Sellers Guide
    • Buyer Info
    • Seller Info
    • Closing Costs
    • Home Appraisal
    • Home Inspection
    • Loan Checklist
    • Loan Process
    • Loan Programs
  • Contact

Conforming ARMs From 2004-2006 Are Adjusting To 3 Percent

May 11, 2011 by Bob Elliot Leave a Comment

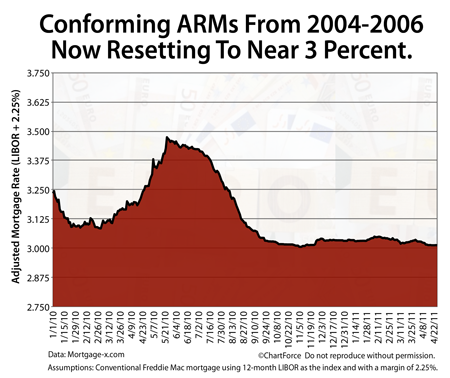
Pending ARM Adjustment Spring/Summer 2011

When a mortgage applicants chooses an adjustable-rate mortgage over a fixed-rate one, he accepts a risk that — at some point in the future — the mortgage’s interest rate will rise. Lately, though, that hasn’t been the outcome.

Since mid-2010, conforming mortgages have adjusted below their initial “teaser” rate consistently, giving homeowners in Minnesota and nationwide reason to ride their respective adjustable-rate mortgages out.

For example, this month, conforming 7-year and 5-year ARMs are adjusting near 3.011 percent based on the most common loan terms of 2004-2006. It’s because of how adjustable-rate mortgages are structured.

Adjustable-rate mortgages follow a defined lifecycle. First, the ARM’s mortgage rate is pegged; held fixed for a set number of years. This period ranges from one year to 10 years; periods of five and seven years are most common.

When the initial fixed-rate period ends, the mortgage rate then adjusts based on a pre-set formula. The formula is established by contract in the mortgage closing paperwork, and is commonly defined as:

(Adjusted Mortgage Rate) = (2.250 percent) + (Current 1-Year LIBOR)

Next, every 12 months, based on the same formula as above, the ARM adjusts again until 30 years have passed and the loan is paid is full.

It’s important to recognize that in the above equation, LIBOR is a variable so as LIBOR goes, so goes your adjusted mortgage rate. And because LIBOR is ultra-low right now, adjusted mortgage rates are ultra-low, too. LIBOR is expected to stay this way until the global economy has recovered more fully. Analysts predict a higher LIBOR by mid-2012.

So, if you have an adjustable-rate mortgage that’s due to reset this season, don’t rush to refinance. For at least one more year, you can benefit from low rates and low payments.  As for the next adjustment, though, that’s anyone’s guess.

Filed Under: Mortgage Guidelines Tagged With: ARM, ARM Reset, LIBOR

Getting More Educational Bang For Your Housing Buck

May 9, 2011 by Bob Elliot Leave a Comment

Get more educational bang for your housing buckA recent joint report from Forbes and GreatSchools debunks a powerful myth in housing. There’s little correlation between Public School Quality and the Median Price Point for a home.
In other words, the most expensive districts don’t always have the best schools. And spending per pupil seems only loosely correlated, too.

The study, titled America’s Best Schools For Your Housing Buck, puts tiny Falmouth, Maine at the top of its 2011 list.

Falmouth is a city of less than 11,000 people, and its school system educates roughly 2,000 children. With a median home sale price of near $350,000, Falmouth is the only city to score a 100 on the Forbes/GreatSchools list.

The complete Top 10 Best Schools For Your Housing Buck list follows:

  1. Falmouth, ME (Score: 100; Median Price: $351,550)
  2. Mercer Island, WA (Score: 99.12; Median Price: $708,740)
  3. Pelle, IA (Score: 98.25; Median Price: $148,200)
  4. Barrington, RI (Score: 97.96; Median Price: $296,010)
  5. Bedford, NH (Score: 97.96; Median Price: $293,730)
  6. Manhattan Beach, CA (Score: 97.69; Median Price: $1,278,980)
  7. Moraga, CA (Score: 97.69; Median Price: $722,010)
  8. Parkland, FL (Score: 95.98; Median Price: $426,390)
  9. St, Johns, FL (Score: 95.98; Median Price: $181,700)
  10. Southlake, TX (Score: 95.74; Median Price: $476,880)

One reason why Falmouth, Maine, tops this list is because the area’s Unemployment Rate is low, and so is Teacher Turnover — just two teachers have left for jobs in other districts since 1998. In fact, each of the ranking cities boast similar strengths.

To see the Top 10 areas in a variety of price ranges, visit the Forbes website.

Filed Under: Rankings Tagged With: Forbes, Housing Stats, Schools

Foreclosures And Short Sales Distorting “Home Price Trackers”

May 6, 2011 by Bob Elliot Leave a Comment

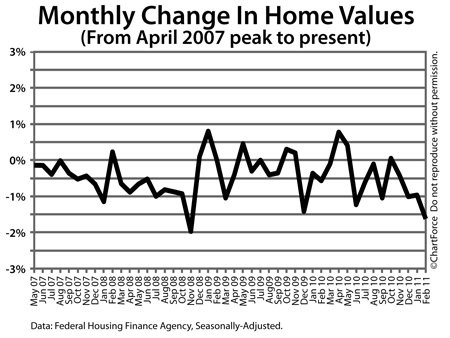
HPI Monthly Changes From April 2007 Peak

In an echo of February’s Case-Shiller Index report, the government’s own home price-tracker — the Home Price Index — showed home values slipping between January and February 2011.

The Federal Home Finance Agency data had home values down 1.6 percent nationwide in February, on average, marking the fourth straight month in which prices fell. 

Furthermore, all 9 regions posted losses from the month prior:

  • Mountain Region : -3.7% from January
  • East South Central : -0.6% from January
  • South Atlantic : -0.9% from January
  • New England : -2.0% from January

Before you draw conclusions, however, note that the data at which we’re looking has several major flaws to it.

First, it’s old. We’re now in the first week of May and the FHFA’s most recent release only covers through February, a time period ending roughly 60 days ago. That’s a long delay and today’s purchase market in St Paul looks much different from the one of February. 

Just ask a real estate agent and they’ll tell you — purchase activity is rising.

Second, the FHFA Home Price Index reports on home value changes between consecutive Fannie Mae or Freddie Mac-securitized transactions only. This might be creating an overweight of “distressed properties” in the index which, in turn, drags down valuations.

Distressed homes account for 40% of all home resales and typically sell at 20 percent discounts.

And, lastly, although the Home Price Index is a national report, real estate as a market is decidedly not national. To the contrary, it’s extremely local. As an individual, you don’t buy, sell or own homes in all 50 states. You buy them in a specific state, and a specific neighborhood. 

The national data is useless to you in that respect.

We can’t discount the Home Price Index data entirely, but should remember that it paints a clearer picture of where housing has been versus where housing is going. As a home buyer or homeowner, it’s the future of home values that matters more.

Filed Under: Housing Analysis Tagged With: FHFA, Home Price Index, HPI

  • « Previous Page
  • 1
  • …
  • 1092
  • 1093
  • 1094
  • 1095
  • 1096
  • …
  • 1133
  • Next Page »

Connect with Me!

Let’s Keep In Touch!

  • This field is for validation purposes and should be left unchanged.

Quick Links

  • About Me
  • Accessibility Statement
  • Blog
  • Contact

Looking For Something?

Categories

Copyright © 2025 · Powered by MySMARTblog

Copyright © 2025 · Genesis Sample Theme on Genesis Framework · WordPress · Log in