U.S. house prices declined 1.6 percent on a seasonally adjusted
basis from January to February. Source: FHFA Home Price Index Press Release
U.S. house prices declined 1.6 percent on a seasonally adjusted
basis from January to February. Source: FHFA Home Price Index Press Release
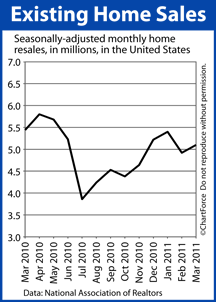
 Home resales rose 4 percent last month, according to the March Existing Home Sales report. A total of 5.1 million homes were sold on an annualized, seasonally-adjusted basis.
The strong results re-establish the national, long-term trend toward rising home resales.
March marked the 6th month out of eight in which sales volume has increased and sales are up 32 percent from July 2010 lows.
Home supply has resumed its downward trajectory, too.
At the current pace of sales, the entire home resale inventory would be depleted in 8.4 months. This is 0.1 months faster as compared to February, and a full month faster than the 12-month average.
The Existing Home Sales report also included a breakdown by buyer-type.
35 percent of buyers paid in cash.
And, perhaps most noteworthy, according to the National Association of REALTORS®, 40 percent of March home resales were “distressed properties”. Distressed homes include foreclosures, short sales, and REO and typically sell at discounts “in the vicinity” of 20 percent.
Home prices in Minneapolis are based on the basic economic theory of Supply and Demand. So, with home supplies dropping and demand for homes rising, it’s reasonable to expect home values to rise later this year.
If you’re in the market for a home, play the recent trends to your advantage. Today, homes are affordable and mortgage rates are low. This may not be the case later this year. The best “deals” of the year may be what you buy now.
Woodbury Single Family MLS Solds for Mar 2011
Solds – 39
Average Sale Price – $280,002
Average $ Sqft – $101
Average Days on Market – 83
MLS Market Summary Sheet: Woodbury MLS SF Sold Comp Summary Mar 2011
For Woodbury Homes and Properties MLS Realtime
Don’t miss City of Woodbury Real Estate Trends, Schools, Walk Score +
* A Comparable Market Analysis (CMA) for homes is like the Blue Book for cars. The Comparables Sold Summary portion includes: the area of interest, sold price, # of bedrooms, # of baths, total finished square footage (TFSF), $ per square foot ($/Sq), year built, style, sold date, days on the market (DOM), cumulative days on the market (CDOM), and the averages for the time specified in the report. Comparables are a way to help sellers and potential buyers understand the market and set a price.
The information is deemed reliable, but not verified or guaranteed