Minnesota Homes Today Local & National News

  • Home
  • About Us
  • Blog
  • Resources
    • Buyers Guide
    • Sellers Guide
    • Buyer Info
    • Seller Info
    • Closing Costs
    • Home Appraisal
    • Home Inspection
    • Loan Checklist
    • Loan Process
    • Loan Programs
  • Contact

Building Permits Rise In All 4 Regions

April 20, 2011 by Bob Elliot Leave a Comment

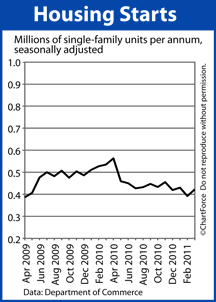
Housing Starts (Apr 2009 - Mar 2011)According to the Census Bureau, seasonally-adjusted, single-family Housing Starts rebounded in March, increasing 8 percent over February’s 2-year low.

We can’t put too much faith in the data, however, because for the second straight month, the government reports that the data’s margin of error — 15 percent — exceeds its actual measurement.

As written in the footnotes, there’s no “statistical evidence to conclude that the actual change [in Housing Starts] is different from zero.”

In other words, single-family Housing Starts may have dropped up to 7 percent last month, or may have increased by as much as 22 percent. We won’t know for certain until several months from now. As the Census Bureau gathers more data, it will revise its initial monthly findings.

Such adjustments are common. February’s starts were revised higher by 4.5%, for example.

Also included in the Census Bureau’s report is the March 2011 Building Permits tally. As compared to February, permits were higher by 6 percent nationwide. This is a noteworthy development because permits-issued is an excellent forward-predictor for housing.

When permits are issued, 86 percent of them will start construction within 60 days. This means that new home sales and housing stock should follow the Building Permits report trend, but on a 2-month delay.

Permits were strong in all 4 regions last month:

  • Northeast : +2.6 percent from February
  • Midwest : +10.0 percent from February
  • South : +5.3 percent from February
  • West : +5.3 percent from February

With Building Permits rising, we can infer that the housing market is improving.

Therefore, if you’re currently looking for new construction, consider that the market may be less favorable for buyers 4-6 months from now than it is today. Especially because homebuilders are already projecting higher sales volume.

The better time to buy new construction — relative — may be now.

Filed Under: Housing Analysis Tagged With: Building Permits, Census Bureau, Housing Starts

Savage Sold Homes in March 2011

April 17, 2011 by Bob Elliot Leave a Comment

Savage Single Family MLS Solds for Mar 2011

Solds – 24

Average Sale Price – $206,697

Average $ Sqft – $84

Average Days on Market – 77

MLS Market Summary Sheet: Savage MLS Sold Comp Summary Mar 2011 

For  Savage Homes and Properties MLS Realtime

Don’t miss City of Savage Real Estate Trends, Schools, Walk Score +

* A Comparable Market Analysis (CMA) for homes is like the Blue Book for cars. The Comparables Sold Summary portion includes: the area of interest, sold price, # of bedrooms, # of baths, total finished square footage (TFSF), $ per square foot ($/Sq), year built, style, sold date, days on the market (DOM), cumulative days on the market (CDOM), and the averages for the time specified in the report. Comparables are a way to help sellers and potential buyers understand the market and set a price.

The information is deemed reliable, but not verified or guaranteed

Filed Under: Savage Homes Tagged With: Savage Sold Homes March 2011

Roseville Sold Homes in March 2011

April 17, 2011 by Bob Elliot Leave a Comment

Roseville Single Family MLS Solds for Mar 2011

Solds – 20

Average Sale Price – $201,773

Average $ Sqft – $95

Average Days on Market – 94 

MLS Market Summary Sheet: Roseville MLS Sold Comp Summary Mar 2011 

For Roseville Homes and Properties MLS Realtime

Don’t miss City of Roseville Real Estate Trends, Schools, Walk Score +

* A Comparable Market Analysis (CMA) for homes is like the Blue Book for cars. The Comparables Sold Summary portion includes: the area of interest, sold price, # of bedrooms, # of baths, total finished square footage (TFSF), $ per square foot ($/Sq), year built, style, sold date, days on the market (DOM), cumulative days on the market (CDOM), and the averages for the time specified in the report. Comparables are a way to help sellers and potential buyers understand the market and set a price.

The information is deemed reliable, but not verified or guaranteed

Filed Under: Roseville Homes Tagged With: Roseville Sold Homes March 2011

  • « Previous Page
  • 1
  • …
  • 1101
  • 1102
  • 1103
  • 1104
  • 1105
  • …
  • 1133
  • Next Page »

Connect with Me!

Let’s Keep In Touch!

  • This field is for validation purposes and should be left unchanged.

Quick Links

  • About Me
  • Accessibility Statement
  • Blog
  • Contact

Looking For Something?

Categories

Copyright © 2025 · Powered by MySMARTblog

Copyright © 2025 · Genesis Sample Theme on Genesis Framework · WordPress · Log in