Minnesota Homes Today Local & National News

  • Home
  • About Us
  • Blog
  • Resources
    • Buyers Guide
    • Sellers Guide
    • Buyer Info
    • Seller Info
    • Closing Costs
    • Home Appraisal
    • Home Inspection
    • Loan Checklist
    • Loan Process
    • Loan Programs
  • Contact

Apple Valley Sold Homes! March 2011

April 13, 2011 by Bob Elliot Leave a Comment

Apple Valley Single Family MLS Solds for Mar 2011

Solds – 28

Average Sale Price – $211,596

Average $ Sqft – $93

Average Days on Market –  102

MLS Market Summary Sheet: Apple Valley MLS Sold Comp Summary Mar 2011 

For Apple Valley Homes and Properties MLS Realtime

Don’t miss City of Apple Valley Real Estate Trends, Schools, Walk Score +

* A Comparable Market Analysis (CMA) for homes is like the Blue Book for cars. The Comparables Sold Summary portion includes: the area of interest, sold price, # of bedrooms, # of baths, total finished square footage (TFSF), $ per square foot ($/Sq), year built, style, sold date, days on the market (DOM), cumulative days on the market (CDOM), and the averages for the time specified in the report. Comparables are a way to help sellers and potential buyers understand the market and set a price.

The information is deemed reliable, but not verified or guaranteed.
Filed Under: Apple Valley Homes Tagged With: Apple Valley Sold Homes Mar 2011

Get Your Applications In : FHA Mortgage Insurance Premiums Rising 0.25 Percent April 18, 2011

April 13, 2011 by Bob Elliot Leave a Comment

FHA Mortgage Insurance Changes

After this week ends, the FHA is raising mortgage insurance premiums on its new St Paul borrowers. It’s the FHA’s third such increase in the last 12 months.

Beginning with FHA Case Numbers assigned April 18, 2011, mortgage insurance premiums will be higher by 25 basis points per year, or 0.25%.

Against a $200,000 loan size, the MIP increase adds $500 to an FHA-insured borrower’s annual cost of homeownership. All new FHA loans are subject to the increase — purchases and refinances.

Existing FHA-insured homeowners across Minnesota are unaffected. Premiums do not rise for loans already made.

The FHA is increasing its mortgage insurance rates because, as a group, the FHA is insuring a much larger percentage of the U.S. housing market. 

In 2006, the FHA held a 4 percent market share. By 2010, that share ballooned to 19 percent and, today, it’s estimated to be even higher.

In its official statement, the FHA says that the quarter-point MIP bump will “significantly strengthen” its reserves which are depleted because of delinquencies and defaults. By law, the FHA’s capital reserves must meet certain levels. 

Therefore, to meet these requirements, the FHA is rolling out its new mortgage insurance premium schedule:

  • 15-year loan term, loan-to-value > 90% : 0.50% MIP per year
  • 15-year loan term, loan-to-value <= 90% : 0.25% MIP per year
  • 30-year loan term, loan-to-value > 95% : 1.15% MIP per year
  • 30-year loan term, loan-to-value <= 95% : 1.10% MIP per year

In order to calculate what your FHA monthly mortgage insurance premium would be, multiply your beginning loan size by your insurance premium in the chart above, then divide by 12. 

The FHA also charges a 1 percent, up-front mortgage insurance premium at closing. That figure remains unchanged.

Filed Under: FHA Tagged With: FHA, FHA Mortgages, MIP, Mortgage Insurance Premium

Retail Sales Report Should Spell Higher Mortgage Rates For Wednesday

April 12, 2011 by Bob Elliot Leave a Comment

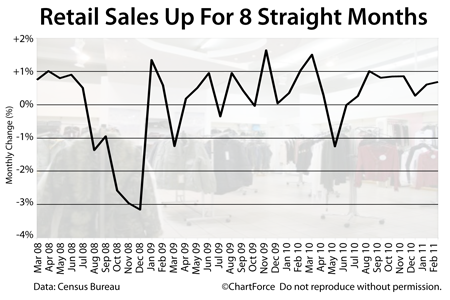
Retail Sales Rising -- 8 Straight Months

Consumer spending is alive and well, it seems — unwelcome news for today’s home buyers. 

Wednesday, the Census Bureau will release its March Retail Sales figures and the report is expected to show higher sales receipts for the 9th straight month. A strong reading like that should spell higher mortgage rates in St Paul and nationwide.

The connection between Retail Sales and mortgage rates is fairly tight. Retail Sales are “consumer spending” and consumer spending accounts for the majority of the U.S. economy. The U.S. economy, of course, is a dominant force in setting the direction in which mortgage rates are headed.

For example, in 2010, it was a weak economy and murky outlook that helped drive mortgage rates to all-time lows. Since last year, however, the jobs market has started its recovery, monthly receipts have returned to all-time highs, and the Federal Reserve is revising growth estimates for 2011.

Not surprisingly, mortgage rates have reversed, too.

As compared to 6 months ago, conforming rates are higher by 0.750%. Home affordability across Minnesota is taking a hit. Plus, the stronger the economy appears to be, the more likely for mortgage rates to climb more.

It’s why tomorrow’s Retail Sales report is so important. 

If you’re under contract for a home, or even evaluating the merits of a refinance, there’s a lot of risk in “floating” your mortgage rate. The more prudent plan is to find a rate at which you’re comfortable with the payment, and lock it in.

And you may want to take that lock sooner than you had planned — if only to protect your monthly payments. Once tomorrow’s Retail Sales report hits, it may be too late. Especially if receipts rise for the 10th straight month.

The Retail Sales report is due for release at 8:30 AM ET.

Filed Under: Retail Sales, The Economy Tagged With: Economy, Non-Farm Payrolls, Retail Sales

  • « Previous Page
  • 1
  • …
  • 1113
  • 1114
  • 1115
  • 1116
  • 1117
  • …
  • 1133
  • Next Page »

Connect with Me!

Let’s Keep In Touch!

  • This field is for validation purposes and should be left unchanged.

Quick Links

  • About Me
  • Accessibility Statement
  • Blog
  • Contact

Looking For Something?

Categories

Copyright © 2025 · Powered by MySMARTblog

Copyright © 2025 · Genesis Sample Theme on Genesis Framework · WordPress · Log in