Minnesota Homes Today Local & National News

  • Home
  • About Us
  • Blog
  • Resources
    • Buyers Guide
    • Sellers Guide
    • Buyer Info
    • Seller Info
    • Closing Costs
    • Home Appraisal
    • Home Inspection
    • Loan Checklist
    • Loan Process
    • Loan Programs
  • Contact

S&P Case-Shiller Home Price Indices: U.S. Home Price Growth Slows in August

October 28, 2022 by Bob Elliot

S&P Case-Shiller Home Price Indices: U.S. Home Price Growth Slows in AugustU.S home price growth slowed for the second consecutive month in August according to S&P Case-Shiller’s national home price index. National home price growth fell by -9.8 percent year-over-year as compared to July’s year-over-year reading of  -5.3 percent. Home price growth slowed by -1.1 percent month-to-month from July to August.

Rising Mortgage Rates and Recession Worries Dampen Homebuyer Interest

The Mortgage Bankers Association forecasted a recession in 2023 and expects mortgage rates to fall to approximately 5.40 percent by the end of 2023. Mike Fratantini, senior vice president and chief economist at the MBA, said: “The upside of [a potential recession] for the industry is that it’s likely going to bring rates down a little bit.” Current rates for 30-year fixed-rate mortgages are near seven percent; the MBA expects 30-year fixed mortgage rates to fall to approximately 5.40 percent by the end of 2023.

Rising mortgage rates coupled with high home prices created affordability concerns and challenged would-be buyers in meeting mortgage approval requirements. Less demand for homes caused home price growth to slow nationwide.

S&P Case-Shiller 20-City Home Price Index: August Home Price Growth Slows in All Cities

Home price growth peaked in April with a  national home price growth rate of 21.2 percent year-over-year, but slowed to a pace of 16.0 percent in July and 13.1 percent in August. The top three cities in the 20-City Index were Miami, Florida with 28.6 percent home price growth. Home prices rose by 28.0 percent in Tampa, Florida, and were 21.3 percent higher in Charlotte, North Carolina.

In related news, the Federal Housing Finance Agency released its House Price Index for August. Home prices for homes owned or financed by Fannie Mae and Freddie Mac fell by -0.7 percent in August. This was the first time since March 2011 that the FHFA HPI decreased for two consecutive months.

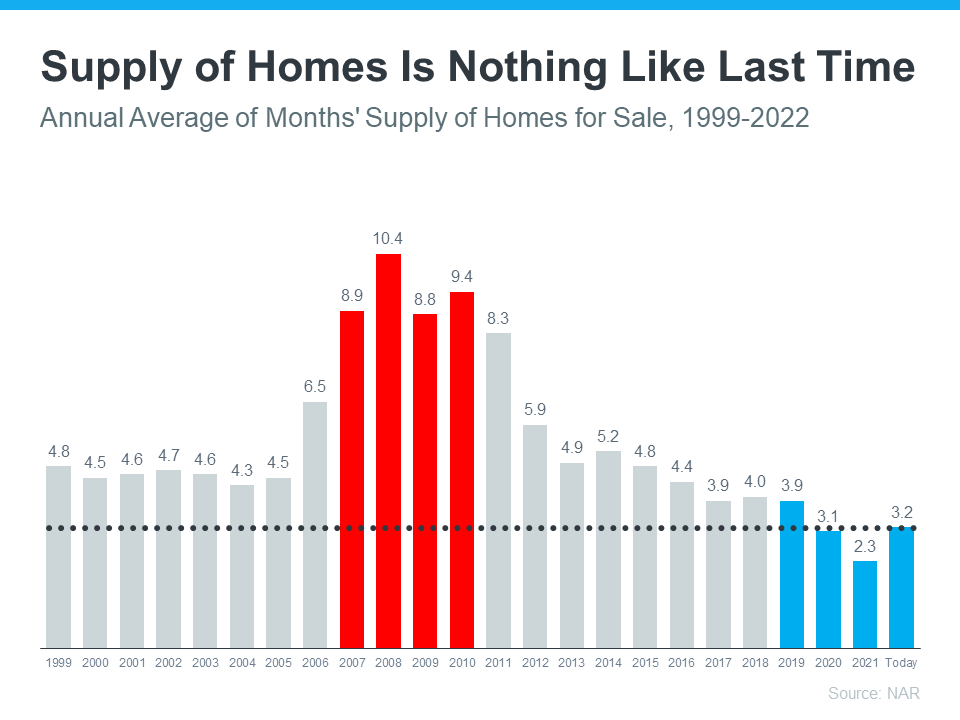
Inventories of newly-built homes were higher than normal at a 9.2 months supply. Real estate pros typically consider a  six- months supply of homes for sale reflective of a balanced housing market.  Rising materials costs caused home builders to raise home prices; the median home price of a new home in August was $470,600 and 13.90 percent higher year-over-year, but some builders are reducing prices and offering buyer incentives on new homes as sales falter.

Filed Under: Financial Reports Tagged With: Case-Shiller, Financial Report, Jobless Claims

Keeping Today’s Housing Market in Perspective Is Key When You Sell

October 27, 2022 by Bob Elliot Leave a Comment

Keeping Today’s Housing Market in Perspective Is Key When You Sell

Today’s housing market is cooling from the frenzy it saw over the past two years. Let’s connect so you can have the expert advice you need to sell your house this season.
Watch Now

Filed Under: Home Sellers, Uncategorized Tagged With: Home Buying, Home Selling, Housing Market

3 Graphs Showing Why Today’s Housing Market Isn’t Like 2008

October 27, 2022 by Bob Elliot Leave a Comment

3 Graphs Showing Why Today’s Housing Market Isn’t Like 2008 | MyKCM

With all the headlines and talk in the media about the shift in the housing market, you might be thinking this is a housing bubble. It’s only natural for those thoughts to creep in that make you think it could be a repeat of what took place in 2008. But the good news is, there’s concrete data to show why this is nothing like the last time.

There’s Still a Shortage of Homes on the Market Today, Not a Surplus

For historical context, there were too many homes for sale during the housing crisis (many of which were short sales and foreclosures), and that caused prices to fall dramatically. Supply has increased since the start of this year, but there’s still a shortage of inventory available overall, primarily due to almost 15 years of underbuilding homes.

The graph below uses data from the National Association of Realtors (NAR) to show how the months’ supply of homes available now compares to the crash. Today, unsold inventory sits at just a 3.2-months’ supply at the current sales pace, which is significantly lower than the last time. There just isn’t enough inventory on the market for home prices to come crashing down like they did last time, even though some overheated markets may experience slight declines.

3 Graphs Showing Why Today’s Housing Market Isn’t Like 2008 | MyKCM

Mortgage Standards Were Much More Relaxed Back Then

During the lead-up to the housing crisis, it was much easier to get a home loan than it is today. Running up to 2006, banks were creating artificial demand by lowering lending standards and making it easy for just about anyone to qualify for a home loan or refinance their current home.

Back then, lending institutions took on much greater risk in both the person and the mortgage products offered. That led to mass defaults, foreclosures, and falling prices. Today, things are different, and purchasers face much higher standards from mortgage companies.

The graph below uses Mortgage Credit Availability Index (MCAI) data from the Mortgage Bankers Association (MBA) to help tell this story. In that index, the higher the number, the easier it is to get a mortgage. The lower the number, the harder it is. In the latest report, the index fell by 5.4%, indicating standards are tightening.

3 Graphs Showing Why Today’s Housing Market Isn’t Like 2008 | MyKCM

This graph also shows just how different things are today compared to the spike in credit availability leading up to the crash. Tighter lending standards over the past 14 years have helped prevent a scenario that would lead to a wave of foreclosures like the last time.

The Foreclosure Volume Is Nothing Like It Was During the Crash

Another difference is the number of homeowners that were facing foreclosure after the housing bubble burst. Foreclosure activity has been lower since the crash, largely because buyers today are more qualified and less likely to default on their loans. The graph below uses data from ATTOM Data Solutions to help paint the picture of how different things are this time:

3 Graphs Showing Why Today’s Housing Market Isn’t Like 2008 | MyKCM

Not to mention, homeowners today have options they just didn’t have in the housing crisis when so many people owed more on their mortgages than their homes were worth. Today, many homeowners are equity rich. That equity comes, in large part, from the way home prices have appreciated over time. According to CoreLogic:

“The total average equity per borrower has now reached almost $300,000, the highest in the data series.”

Rick Sharga, Executive VP of Market Intelligence at ATTOM Data, explains the impact this has:

“Very few of the properties entering the foreclosure process have reverted to the lender at the end of the foreclosure. . . . We believe that this may be an indication that borrowers are leveraging their equity and selling their homes rather than risking the loss of their equity in a foreclosure auction.”

 This goes to show homeowners are in a completely different position this time. For those facing challenges today, many have the option to use their equity to sell their house and avoid the foreclosure process.

Bottom Line

If you’re concerned we’re making the same mistakes that led to the housing crash, the graphs above should help alleviate your fears. Concrete data and expert insights clearly show why this is nothing like the last time.

Filed Under: Housing Market Insights, Uncategorized Tagged With: home sellers, homebuyers, Housing Market

  • « Previous Page
  • 1
  • …
  • 111
  • 112
  • 113
  • 114
  • 115
  • …
  • 1133
  • Next Page »

Connect with Me!

Let’s Keep In Touch!

  • This field is for validation purposes and should be left unchanged.

Quick Links

  • About Me
  • Accessibility Statement
  • Blog
  • Contact

Looking For Something?

Categories

Copyright © 2025 · Powered by MySMARTblog

Copyright © 2025 · Genesis Sample Theme on Genesis Framework · WordPress · Log in