Minnesota Homes Today Local & National News

  • Home
  • About Us
  • Blog
  • Resources
    • Buyers Guide
    • Sellers Guide
    • Buyer Info
    • Seller Info
    • Closing Costs
    • Home Appraisal
    • Home Inspection
    • Loan Checklist
    • Loan Process
    • Loan Programs
  • Contact

Find A Mortgage Rate Strategy Ahead Of Friday’s Job Report

November 1, 2012 by Bob Elliot Leave a Comment

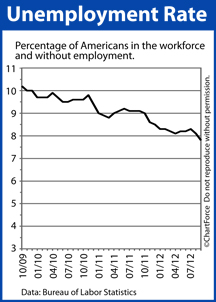
Unemployment RateFriday morning, the government’s Bureau of Labor Statistics will release its Non-Farm Payrolls report, more commonly called the “jobs report”.

Depending on how the jobs data reads, FHA and conforming mortgage rates may rise, or fall. This is because today’s mortgage market is closely tied to the U.S. economy, and the U.S. economy is closely tied to job growth.

Economists expect that employers have added 125,000 net new jobs to their payrolls in October 2012, up from September’s tally of 114,000 net new jobs. Jobs have been added to the economy over 24 consecutive months leading into Friday’s release, and approximately 4.7 million jobs have been created in the private sector since early-2010.

So, what does this mean for home buyers and refinancing households throughout St Paul ? It means that mortgage rates may get volatile beginning tomorrow morning.

Improving jobs numbers tend to push mortgage rates up, as it signals to investors that the U.S. economy is strengthening. If the actual jobs reports shows more than 125,000 net new jobs created, therefore, look for mortgage rates to rise.

Conversely, a weaker-than-expected report injects fear into the market, causing investors to purchase safer assets including U.S. Treasury bonds and mortgage-backed bonds. This moves mortgage rates lower.

Markets will also watch for the monthly Unemployment Rate. After falling to a 4-year low of 7.8 percent in September, economists anticipate that October’s unemployment rate will rise 0.1 percentage point to 7.9%.

The good news for rate shoppers is that mortgage rates remain low. Freddie Mac’s weekly mortgage rate survey puts the 30-year fixed rate mortgage below 3.50% nationwide for borrowers willing to pay 0.7 discount points. Furthermore, a forecast from the Mortgage Bankers Association predicts that the 30-year fixed rate will remain below 4% for at least the next 8 months and low mortgage rates help to keep home payments low.

The Bureau of Labor Statistics releases the jobs report at 8:30 AM ET Friday.
Filed Under: The Economy Tagged With: Jobs Report, mortgage rate, Non-Farm Payrolls, Unemployment Rate

19 of 20 Case-Shiller Index Markets Improve In August

October 31, 2012 by Bob Elliot Leave a Comment

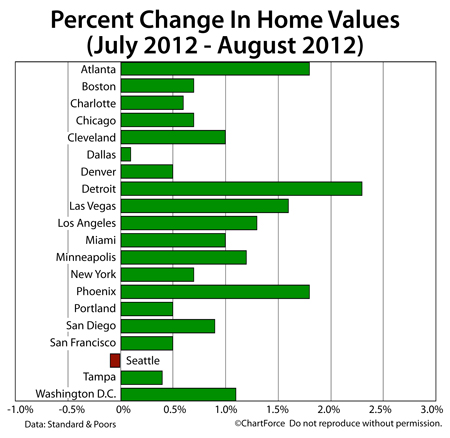
Case-Shiller Index : Home Prices Between July and August 2012

Home value rose to close out the summer, according to the S&P/Case-Shiller Index, a national home-valuation tracker.

Nationwide, values rose 0.9% between July and August 2012 with 19 of 20 tracked markets showing improvement. Only one tracked city — Seattle, Washington — showed a decrease, falling just 0.1 percent.

On an annual basis, 17 of the 20 Case-Shiller Index markets improved, led by Phoenix. Home values in the Arizona city are up 18.8 percent from August 2011. The next closest city in terms of home price gains is Detroit, Michigan at 7.6 percent

We should temper our excitement for the August Case-Shiller Index, however. Although it suggests an ongoing U.S. housing recovery, the methodology of the Case-Shiller Index is far-from-perfect. In fact, one could argue that the index is more effective for policy-makers than for actual buyers and sellers of real estate.

There are three reasons for this :

  1. The Case-Shiller Index tracks home prices of single-family homes only. Multi-unit homes are excluded.
  2. The Case-Shiller Index can be distorted by “discounted” home sales (e.g.; foreclosure, short sale).
  3. The Case-Shiller Index publishes on a two-month delay — data is hardly current.

Beyond the above three points, however, the Case-Shiller Index falls short in another area — it ignores the basic tenet of housing that “all real estate is local”. In using 20 cities to represent the entire United States, the Case-Shiller Index reduces more than 3,100 municipalities into a single “market”.

Even within its 20 tracked cities, the Case-Shiller Index fails short as a housing market barometer. This is because — even with cities — home values vary. Some Minneapolis zip codes perform better than others, for example, as do some streets. The Case-Shiller Index can’t capture markets with that level of detail.

National housing data helps in spotting broader trends of growth but provides very little for today’s active buyers and sellers of real estate who need “real-time” data. For that, talk to a local real estate agent.

Filed Under: Housing Analysis Tagged With: Case-Shiller Index, Home Values, Phoenix

Pending Home Sales Index Suggests Housing Momentum Into 2013

October 30, 2012 by Bob Elliot Leave a Comment

Pending Home Sales Index 09-2012The home resales is expected to finish the year with strength.

Last month, for the fifth straight month, the Pending Home Sales Index hovered near its benchmark value of 100, registering 99.5 in September.

he Pending Home Sales Index tracks homes under contract to sell, but not yet sold, and is published by the National Association of REALTORS®. The index is a relative one. It compares today’s housing market activity to the housing market activity of 2001 — the index’s first year of existence.

The Pending Home Sales Index has averaged 99.1 this year.

Among housing market indicators, the Pending Home Sales Index is unique. It doesn’t report on prior market activity as the Existing Home Sales and New Home Sales reports do. By contrast, the Pending Home Sales Index is a forward-looking indicator.

The real estate trade association tell us that 80% of U.S. homes under contract go to closing within 60 days, and many of the rest go within Months 3 and 4. In this way, the monthly Pending Home Sales Index can foreshadow to today’s St Paul home buyers and sellers what’s next for housing.

Based on September’s Pending Home Sales Index, then, we should expect to see closed home sales stay strong through November and December. That said, home sales are expected to vary by region.

Here is how the Pending Home Sales Index broke down by area last month as compared to one year ago on a seasonally-adjusted, annualized basis :

  • Northeast Region : +26.1% from September 2011
  • Midwest Region : +19.3% from September 2011
  • South Region : +17.6% from September 2011
  • West Region : +0.8% from September 2011

Often, the last few months of a year are considered to be a “slow” period for the housing market. Based on regional, annual Pending Home Sales Index improvements, though, 2012 may be different. The market looks poised to finish with momentum that may carry home prices higher into 2013.

For today’s home buyers, mortgage rates remain low and home prices have only started to climb.

For the week ending Oct, 20 2012  Twin Cities Pending Sales increased 33.3% to 1,012. Data Courtesy Minneapolis Area Association of REALTORS.

Filed Under: Housing Analysis Tagged With: NAR, Pending Home Sales Index, PHSI

  • « Previous Page
  • 1
  • …
  • 930
  • 931
  • 932
  • 933
  • 934
  • …
  • 1133
  • Next Page »

Connect with Me!

Let’s Keep In Touch!

  • This field is for validation purposes and should be left unchanged.

Quick Links

  • About Me
  • Accessibility Statement
  • Blog
  • Contact

Looking For Something?

Categories

Copyright © 2025 · Powered by MySMARTblog

Copyright © 2025 · Genesis Sample Theme on Genesis Framework · WordPress · Log in