Minnesota Homes Today Local & National News

  • Home
  • About Us
  • Blog
  • Resources
    • Buyers Guide
    • Sellers Guide
    • Buyer Info
    • Seller Info
    • Closing Costs
    • Home Appraisal
    • Home Inspection
    • Loan Checklist
    • Loan Process
    • Loan Programs
  • Contact

New Home Supply Remains Firmly In “Seller’s Market” Territory

September 27, 2012 by Bob Elliot Leave a Comment

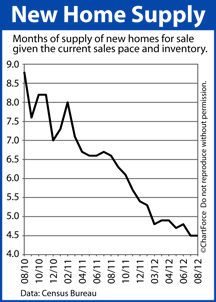
New Home Supply chartThe market for new construction homes remains strong nationwide.

According to the U.S. Census Bureau, the number of new homes sold slipped 0.3 percent in August 2012 to a seasonally-adjusted, annualized 373,000 units sold — just 1,000 units less than July 2012 and the second-highest reading since April 2010.

April 2010 was the last month of that year’s tax credit which granted home buyers up to $8,000 off of their federal tax bill.

As compared to one year ago, sales of new homes are higher by 28%.

Furthermore, during the same time frame, the median sale price of a new home moved higher by 17 percent. The rising prices, in part, are the result of a shrinking national new home inventory.

When August ended, there were just 141,000 homes for sale nationwide — a 12% drop from the year prior. This suggests that home builders have stopped building without buyers; that some lessons were learned in last decade’s homebuilding frenzy.

At today’s pace of home sales, the entire stock of new homes nationwide would sell out in 4.5 months. As a comparison point, in January 2009, the new home supply reached 12.1 months.

With home supply below 6.0 months, analysts say, it signifies a “seller’s market” and home supplies have not been north of 6.0 months since October 2011. And, based on recent homebuilder confidence surveys, supply doesn’t appear headed back over 6.0 months anytime soon.

Builders in Minnesota and nationwide report that prospective buyer foot traffic is at its highest point in 6 years. Low mortgage rates and affordable housing choices have held demand for new homes strong. Rising rents contribute, too.

For today’s home buyers of new construction, then, shrinking supply amid rising demand portends higher home prices into 2013 and beyond. If you’re a buyer of new construction, therefore, think about moving up your time frame.

The best deals left in housing may be the ones you grab while the calendar still reads 2012. By January, low prices may be gone, and low rates may be, too.
Filed Under: Housing Analysis Tagged With: Census Bureau, New Home Sales, New Home Supply

Home Price Index Shows Values Rising 3.7% From One Year Ago

September 26, 2012 by Bob Elliot Leave a Comment

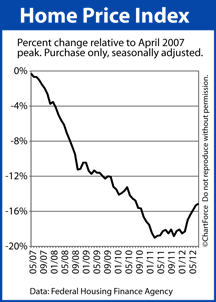
Home Price Index from peak to presentTuesday, the Federal Home Finance Agency’s Home Price Index (HPI) showed home values rising 0.2% on a seasonally-adjusted basis between June and July 2012, and moving +3.7% on an annual basis.

Home values have not dropped month-to-month since January of this year — a span of 6 months.

For today’s home buyers and sellers throughout Minneapolis/St Paul, though, it’s important to recognize on what the HPI is actually reporting.

Or, stated differently, on what the HPI is not reporting. The Home Price Index is based on home price changes of some homes, of certain “types”, with specific mortgage financing only.

As such, it excludes a lot of home sales from its results which skews the final product. We don’t know if home values are really up 0.2% this month — we only know that’s true for the home that the HPI chooses to track.

As an example of how certain homes are excluded, because the HPI is published by the Federal Housing Finance Agency and because the FHFA gets its access to home price data from Fannie Mae and Freddie Mac, it’s upon data these two entities upon which the Home Price Index is built.

Home price data from the Federal Housing Administration (FHA), from local credit unions, and from all-cash sales, for example, are excluded from the HPI because the FHFA has no awareness that the transaction ever happened.

In 2006, this may not have been a big deal; the FHA insured just 4 percent of the housing market at the time. Today, however, the FHA is estimated to insure more than 20% of new home purchases. Furthermore, in August, more than 1 in 4 sales were made with cash.

None of these home sales were included in the HPI.

Furthermore, the Home Price Index excludes certain home types from its findings.

Home sales of condominiums, cooperatives, multi-unit homes and planned unit developments (PUD) are not used in the calculation of the HPI. In some cities, including Chicago and New York City, these property types represent a large percentage of the overall market. The HPI ignores them.

Like other home-value trackers, the Home Price Index can well highlight the housing market’s broader, national trends but for specific home price data about a specific home or a ZIP code, it’s better to talk with a real estate agent with local market knowledge.

Since peaking in April 2007, the Home Price Index is off 16.4 percent.

Filed Under: Housing Analysis Tagged With: FHFA, Home Price Index, HPI

Existing Home Sales Leap To 2-Year High

September 25, 2012 by Bob Elliot Leave a Comment

Existing Home Sales By Price Tier, August 2012

The home resale market put forth another strong data set last week. Home sales prices are higher nationwide and sales volume has moved to a 2-year high.

According to the National Association of REALTORS®, 4.82 million “existing homes” sold on a seasonally-adjusted, annualized basis in August, representing a near 8 percent improvement from the month prior and a nine percent jump from August 2011.

An existing home is a home which has been previously occupied.

Home sales were unevenly split across price tiers, with more than half of all homes selling for less than $250,000. This suggests that the first-time home buyers and real estate investors continue to be active in today’s market as a foundation for growth is built.

According to the Existing Home Sales data :

  • First-time buyers accounted for 31% of all home sales
  • Real estate investors accounted for 18% of all home sales
  • Other, repeat buyers accounted for 51% of all home sales

Also noteworthy is that “distressed homes” accounted for the smallest percentage of overall home sales since the real estate trade group starting tracking such data.

In August, homes in various stages of foreclosures accounted for 12% of all sales and sold at an average discount of 19 percent below market value. Short sale homes accounted for 10% of all sales and sold at an average discount of 13 percent below market value.

Of all the data in the August Existing Home Sales report, though, perhaps most relevant to today’s buyers is the shrinking national housing supply.

At August’s end, there were 2.47 million homes listed for sale nationwide, a three percent increase from the month prior. However, because the pool of available home buyers is increasing more rapidly than the number of homes for sale, housing supplies fell 0.3 months to 6.1 months.

This means that at the current pace of sales, the entire housing supply would be sold by March 2013.

For today’s home buyers, home affordability appears poised to worsen. Mortgage rates and home prices remain low today, but market conditions like these rarely last long. Talk to your real estate agent about what options you have ahead of you. 2012 is coming to a close.

By 2013, the housing recovery may be fully underway. Minnesota Real Estate Properties Today

Filed Under: Housing Analysis Tagged With: Existing Home Sales, Existing Housing Supply, NAR

  • « Previous Page
  • 1
  • …
  • 938
  • 939
  • 940
  • 941
  • 942
  • …
  • 1133
  • Next Page »

Connect with Me!

Let’s Keep In Touch!

  • This field is for validation purposes and should be left unchanged.

Quick Links

  • About Me
  • Accessibility Statement
  • Blog
  • Contact

Looking For Something?

Categories

Copyright © 2025 · Powered by MySMARTblog

Copyright © 2025 · Genesis Sample Theme on Genesis Framework · WordPress · Log in