Minnesota Homes Today Local & National News

  • Home
  • About Us
  • Blog
  • Resources
    • Buyers Guide
    • Sellers Guide
    • Buyer Info
    • Seller Info
    • Closing Costs
    • Home Appraisal
    • Home Inspection
    • Loan Checklist
    • Loan Process
    • Loan Programs
  • Contact

Pending Home Sales Index Makes New High For 2012

August 30, 2012 by Bob Elliot Leave a Comment

Pending Home Sales Index

In July, the third time this year, the Pending Home Sales Index crossed its benchmark value of 100, moving to 101.7. 

A “pending home sale” is a home under contract to sell, but not yet sold. Data for the index is collected by the National Association of REALTORS® and published monthly.

The rise in July’s Pending Home Sales Index reading is important for two reasons — both of which highlight a U.S. housing market in recovery. Buyer and sellers in St Paul and across the country would do well to pay attention.

First, the Pending Home Sales Index is at its highest point since April 2010, the last month of that year’s federal home buyer tax credit.

From this, we can infer that the rate at which homes are selling in Minnesota and nationwide is approaching the same “stimulated” levels that the tax credit afforded two-plus years ago. The difference is that today there are no buyer tax incentives.

The Pending Home Sales Index readings have climbed steadily since the tax credit’s expiration, too :

  • July 2010 : 78.4 reading
  • July 2011 : 90.5 reading
  • July 2012 : 101.7 reading

Second, because the Pending Home Sales Index is a relative index; and, because it was assigned a value of 100 when it was launched by the real estate trade group in 2001, when the PHSI reads higher than 100, it tells us that homes are going under contract at a faster pace than they did during the index’s first year.

2001 was a strong year for the U.S. housing market. 2012 is on path to be a stronger one.

80% of homes go to closing within two months of contract so, based on the July 2012 Pending Home Sales Index, we should expect for the Existing Home Sales report to rise through the rest of summer and into fall. Home supplies may drop and home prices may rise.

The housing market has expanded slowly and steadily dating to October 2011. Based on last month’s PHSI, that momentum will continue.

Filed Under: Housing Analysis Tagged With: NAR, Pending Home Sales Index, PHSI

New Home Sales Reach Multi-Year High

August 29, 2012 by Bob Elliot Leave a Comment

New Home Sales 2010-2012The market for newly-built homes remains strong.
As reported by the U.S. Department of Commerce, 372,000 new homes were sold in July on a seasonally-adjusted, annualized basis. A “new home” is a home that can be considered new construction.

July’s New Home Sales report highlights what today’s buyers of new construction and the nation’s home builders have witnessed for themselves already — that the market for newly-built homes is improving in Minneapolis and nationwide.

The number of new homes sold in July on a seasonally-adjusted, annualized basis matches the tally from May 2012, and is the highest reading since April 2010, the last month of that year’s federal home buyer tax credit.

The South Region continues to account for the majority of new construction sales, posting a 48% market share in July. South Region sales were up 9.1 percent as compared to one year ago. The other 3 regions posted higher sales volume as well :

  • South Region : +9.1% from July 2011
  • Northeast Region : +30.4% from July 2011
  • Midwest Region : +21.7% from July 2011
  • West Region : +63.8% from July 2011

Also noteworthy is that the increase in new home sales is coming at a time when new home supplies are slipping.

At the end of July 2012, there were just 142,000 new homes for sale nationwide. This is the smallest new home housing stock in at least 7 years, and a signal that buyers are buying homes faster than builders can build them. At the current pace of sales, the national supply of new homes would sell out in 4.6 months.

Because economists believe that a 6.0-month supply represents a market in balance, the current new home market is decidedly a “sellers market”. Buyers throughout Minnesota should expect higher new home prices ahead.

Dating back to October 2011, the housing market has shown slow, steady growth. Home prices have moved higher and so has builder confidence. If you’re in the market for new construction consider going into contract soon. The longer you wait to buy, the more you may be asked to pay.

Filed Under: Housing Analysis Tagged With: Builder Confidence, New Home Sales, New Home Supply

Government : Home Prices Up 3.0% In Last 12 Months Nationwide

August 28, 2012 by Bob Elliot Leave a Comment

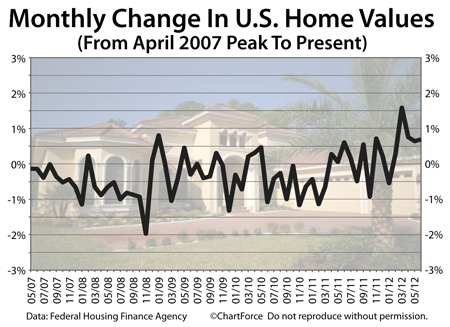
Home Price Index, monthly since April 2007

The housing market recovery appears to be sustainable.

According to the Federal Housing Finance Agency’s Home Price Index, home prices rose by a seasonally-adjusted 0.7 percent between May and June 2012. The index is now up 3.0% over the past 12 months, and made its biggest quarterly gain since 2005 last quarter.

The FHFA’s Home Price Index measures home price changes through successive home sales for homes whose mortgages are backed by Fannie Mae or Freddie Mac, and for which the property type is categorized as a “single-family residence”. 

Condominiums, multi-unit homes and homes with jumbo mortgages, for example, are excluded from the Home Price Index, as are all-cash home sales.

June’s HPI gives buyers and seller in Minneapolis reason to cheer, but it’s important to remember that the Home Price Index — like so many other home valuation trackers — has a severe, built-in flaw. The HPI uses aged data. It’s nearly September, yet we’re talking numbers from June.

Data that’s two months old has limited meaning in today’s housing market. It’s reflective of the housing market as it looked in the past.

And, even then, to categorize the HPI as “two months old” may be a stretch. Because it often takes 45-60 days to close on a home sale, the home sale prices as reported by the July Home Price Index are the result of purchase contracts written from as far back as February 2012.

Buyers and sellers in search of real-time home price data, in other words, won’t get it from the FHFA.

The Home Price Index is a useful housing market gauge for law-makers and economists. It highlights long-term trends in housing which can assist in allocating resources to a particular policy or project. For home buyers and sellers throughout Minnesota , however, it’s decidedly less useful. Real-time data is what’s most important.

For that, talk to a real estate professional.

Filed Under: Housing Analysis Tagged With: FHFA, Home Price Index, HPI

  • « Previous Page
  • 1
  • …
  • 944
  • 945
  • 946
  • 947
  • 948
  • …
  • 1133
  • Next Page »

Connect with Me!

Let’s Keep In Touch!

  • This field is for validation purposes and should be left unchanged.

Quick Links

  • About Me
  • Accessibility Statement
  • Blog
  • Contact

Looking For Something?

Categories

Copyright © 2025 · Powered by MySMARTblog

Copyright © 2025 · Genesis Sample Theme on Genesis Framework · WordPress · Log in