Minnesota Homes Today Local & National News

  • Home
  • About Us
  • Blog
  • Resources
    • Buyers Guide
    • Sellers Guide
    • Buyer Info
    • Seller Info
    • Closing Costs
    • Home Appraisal
    • Home Inspection
    • Loan Checklist
    • Loan Process
    • Loan Programs
  • Contact

Mortgage Rates Rise For Third Straight Week

August 17, 2012 by Bob Elliot Leave a Comment

30-year fixed rates rise

Mortgage rates in St Paul keep on rising.

According to Freddie Mac’s weekly Primary Mortgage Market Survey, for the third straight week, the 30-year fixed rate mortgage rate rose, this time tacking on 3 basis points on a week-over-week basis to 3.62%, on average, nationwide. The 3.62% mortgage rate is available to mortgage applicants willing to pay 0.6 discount points plus a full set of closing costs.

Freddie Mac’s published mortgage rates are compiled from a 125-bank survey.

Looking back, it appears that national 30-year fixed rate mortgage rates bottomed at 3.49% in late-July. In the weeks leading up to that bottom, mortgage rates had dropped in 11 of 12 weeks. Since then, however, mortgage rate have increased steadily, climbing to a 7-week high, depending on where you live. 

Mortgage rates vary by region. As reported by Freddie Mac, mortgage applicants in the South Region are currently paying the highest rates. Applicants in the North Central are paying the lowest.

  • Northeast Region : 3.62% with 0.6 discount points
  • West Region : 3.59% with 0.6 discount points
  • Southeast Region : 3.68% with 0.6 discount points
  • North Central Region : 3.58% with 0.6 discount points
  • Southwest Region : 3.66% with 0.6 discount points

Mortgage rates don’t figure to drop in the coming weeks, either. The same forces that drove mortgage rates down between January-July of this year are the same ones that are driving rates up today — expectations for new Federal Reserve-led stimulus.

Earlier this year, the economy was stalling; growing slowly, but not convincingly. This led to Wall Street speculation for the Federal Reserve to implement a bond-buying program that would lead mortgage rates down, among other outcomes. The Fed repeated comments that it would do what is necessary to keep the economy on track only served to fuel such speculation.

Last month, however, at the Federal Open Market Committee, Ben Bernanke & Co. did not add new stimulus, and seemed content to take a “wait-and-see” approach with the economy. Since then, Europe appears to have put itself on-track and the U.S. economy has shown signs of expansion.   

The August rise in rates is Wall Street reversing its bets; planning for no new stimulus at all.

Mortgage rates remain low, though. If you’ve yet to join this year’s refinance boom, or if you’re hunting for a home, consider locking something in. In a few weeks, mortgage rates may be higher still.
Filed Under: Mortgage Rates Tagged With: 30-Year Fixed, Freddie Mac, mortgage rates, PMMS

Homebuilder Confidence Rises To 5-Year High

August 16, 2012 by Bob Elliot Leave a Comment

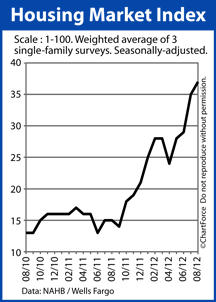
NAHB HMI 2010-2012Home builder confidence rises again.

For August 2012, the National Association of Homebuilders reports the monthly Housing Market Index at 37 — an increase of more than 100% from one year ago and the highest HMI value since February 2007.

The Housing Market Index is an indicator of homebuilder confidence and when it reads 50 or better, the HMI suggests favorable conditions for home builders. Readings below 50 suggest unfavorable conditions for builders.

Despite the recent rise in home builder attitudes, however, the Housing Market Index remains mired below 50 where it’s been since April 2006.

For new construction home buyers in St Paul , the HMI may offer insight into the market for new homes through the end of this year. This is because the NAHB Housing Market Index is a composite survey, meant to gauge builder sentiment in three specific areas — current business, future business, and buyer activity.

When all three fronts are rising, it points to an improving market for sellers (i.e. home builders). Unfortunately, though, what’s good for sellers can be damaging to buyers. Builders are less willing to make concessions on price or product when markets are getting stronger.

In August, home builders saw strength across all three categories :

  • Current Single-Family Sales : 39 (+3 from July)
  • Projected Single-Family Sales : 44 (+1 from July)
  • Buyer Foot Traffic : 31 (+3 from July)

Especially noteworthy in the August HMI is that builders project more sales for the next six calendar months than they have projected at any time in the last 5 years. With mortgage rates at all-time lows and buyer foot traffic growing, it’s no wonder confidence is high.

When demand for homes is strong amid stagnant or falling supplies, home prices rise and that’s exactly what we’re seeing in many U.S. markets. It’s a good time to be a Minnesota home buyer today, but market momentum appears to be shifting.

If you’re in the market for a newly-built home, therefore, the best “deal” may be the one you get today. Next year, your costs may be higher.

Filed Under: Housing Analysis Tagged With: HMI, Homebuilder Confidence, Housing Market Index, NAHB

Home Affordability Sinks For The First Time In 12 Months

August 15, 2012 by Bob Elliot Leave a Comment

Home Affordability Index 2012 Q2Rising home prices are taking a toll on today’s home buyers. For the first time in 4 quarters — and despite falling mortgage rates — home affordability is sinking. 

Earlier this week, the National Association of Home Builders reported the Home Opportunity Index, a measure of home affordability, down to 73.8 for the second quarter of the year. This marks the metric’s first “down” quarter since the second quarter of 2011, and is its lowest reading since December 2010.

A home is considered “affordable” when its payments meet standard mortgage underwriting criteria for families earning the local median income. This definition is used for homes across all U.S. markets — including for homes in Minneapolis.

73.8% of homes sold last quarter were affordable to households earning the national median income of $65,000. This is the 13th straight quarter dating back to 2009 that the index surpassed 70. Prior to 2009, the Home Opportunity Index had not crossed 70 even one time.

Like all real estate data, home affordability varied by locale.

In the Midwest, for example, affordability was highest. 7 of the top 10 most affordable markets nationwide were spread throughout the nation’s heartland. An Alaskan city took the top spot.

The top 5 most affordable cities for home buyers in Q2 2012 were:

  1. Fairbanks, AK (98.7%)
  2. Mansfield, OH (98.1%)
  3. Springfield, OH (95.9%)
  4. Carson City, NV (95.4%)
  5. Kokomo, IN (95.4%)

At #23, Ocala, Florida (91.7%) was the top-ranked South Region city last quarter.

By contrast, the Northeast Region and Southern California remained among the least affordable housing markets nationwide. Led by the New York-White Plains, NY-Wayne, NJ area, 9 of the 10 least affordable areas were in the Mid-Atlantic and California, and for the 17th consecutive quarter the New York metro area was ranked “Least Affordable”.

Just 29.4 percent of homes were affordable to households earning the area’s median income there, down from 31.5 percent three months ago.

The rankings for all 225 metro areas are available for download on the NAHB website.

Filed Under: Housing Analysis Tagged With: HOI, Home Affordability, NAHB

  • « Previous Page
  • 1
  • …
  • 947
  • 948
  • 949
  • 950
  • 951
  • …
  • 1133
  • Next Page »

Connect with Me!

Let’s Keep In Touch!

  • This field is for validation purposes and should be left unchanged.

Quick Links

  • About Me
  • Accessibility Statement
  • Blog
  • Contact

Looking For Something?

Categories

Copyright © 2025 · Powered by MySMARTblog

Copyright © 2025 · Genesis Sample Theme on Genesis Framework · WordPress · Log in