Minnesota Homes Today Local & National News

  • Home
  • About Us
  • Blog
  • Resources
    • Buyers Guide
    • Sellers Guide
    • Buyer Info
    • Seller Info
    • Closing Costs
    • Home Appraisal
    • Home Inspection
    • Loan Checklist
    • Loan Process
    • Loan Programs
  • Contact

New Home Sales Rise

June 27, 2012 by Bob Elliot Leave a Comment

New Home Supply The new construction home sales market continues to improve.

As reported by the Census Bureau, 369,000 new homes were sold last month on a seasonally-adjusted, annualized basis. A “new home” is a home that is considered new construction.

May’s data marks the highest number of new homes sold since April 2010, the last month of that year’s federal home buyer tax credit.

It’s also a 14% increase over the rolling 12-month average.

The news was somewhat expected based on the most recent Homebuilder Confidence survey, which rose to a 5-year high. Home builders have been reporting higher sales volume and rising buyer foot traffic since October of last year.

The May New Home Sales report confirms what builders already told us.

Furthermore, new homes are selling more quickly than builders have built them, lowering the national “home supply” to levels not seen since October 2005. There are currently 145,000 new homes for sale.

A supply of 6.0 months is believed to represent a market in balance. Anything less connotes a “sellers’ market”. At the current pace of sales, the entire new home housing stock would be exhausted in 4.7 months.

The South Region continues to account for the majority of new construction sales, posting a 55% market share in May. South Region sales were up 13 percent as compared to April. The other 3 regions turned in mixed results :

  • Northeast Region : +36.7% from April 2012
  • Midwest Region : -10.6% from April 2012
  • West Region : -3.5% from April 2012

For all its strength, though, the Census Bureau’s New Home Sales data may also be “off”.

Although New Home Sales were said to rise by roughly 8 percent nationally from April to May, the government’s monthly report was also footnoted with a ±12.2% margin of error. This means that the actual New Home Sales reading may have been as high as +20% last month, or as low as -4%. The values could be positive or negative — we can’t know for certain.

However, that’s not to say that the New Home Sales should be ignored.

Longer-term, new home trends have been positive and builder confidence survey suggests the same.  If you’re in the market for new construction in Minneapolis/St Paul, you may want to go into contract soon. Home prices and mortgage rates remain low — a terrific combination for today’s home buyers.
Filed Under: Housing Analysis Tagged With: Census Bureau, New Home Sales, New Home Supply

Existing Home Sales Slip 2% In May

June 26, 2012 by Bob Elliot Leave a Comment

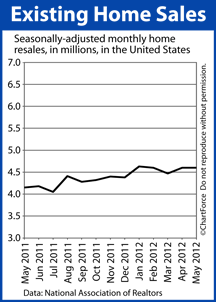
Existing Home SalesHome resales slipped last month; a slight setback for the nation’s housing market’s recovery.
According to the National Association of REALTORS®, Existing Home Sales fell to 4.55 million units in May 2012 on a seasonally-adjusted annualized basis, representing a 2 percent drop from April.

An “existing home” is a home that’s been previously owned or occupied, and cannot be categorized as new construction.

Despite May’s retreat, however, as compared to last year at this time, Existing Home Sales by units are higher by 10 percent. In other words, like everything else in housing, the long-term statistical trend has been a positive one.

The housing market has seen its bottom and is finding balance.

Other data from the Existing Home Sales report includes :

  • First-time buyers accounted for 34% of all purchasers, down from 35% in April
  • Real estate investors accounted for 17% of all purchasers, down from 20% in April
  • Cash buyers accounted for 28% of all purchasers, down from 29% in April

In addition, distressed sales accounted for 25% of all sales in May, down from 28% in April.

“Distressed sales” include the sale of homes in various stages of foreclosure, and of short sales. This is the smallest percentage of homes sold in a “distressed” status since the real estate trade group began tracking the data in 2008.

And, lastly, home supplies rose by 0.1 months to 6.6 months nationwide in May. This means that, at the current pace of sales, the complete U.S. home resale inventory would be sold out before the end of 2012.  A 6-month supply is widely believed to represent a market in balance between buyers and sellers.

There are now 2.49 million homes for sale — a 20% reduction from May 2011.

Home resales may have slipped last months but volume remains brisk nationwide. All-time low mortgage rates and high home affordability are keeping buyers in the market. Home prices are rising in many U.S. cities as the housing market continues its slow, steady recovery.

Filed Under: Housing Analysis Tagged With: Existing Home Sales, Existing Home Supply, NAR

Mortgage Rates Make New Lows At 3.66%

June 22, 2012 by Bob Elliot Leave a Comment

Freddie Mac mortgage rates for June 21 2012

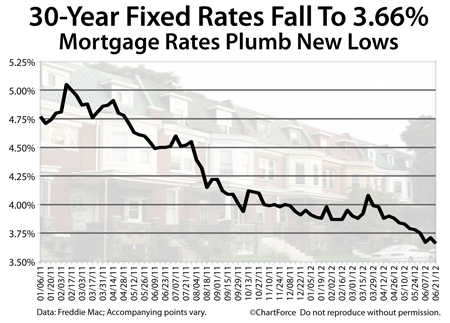
Mortgage rates have resumed their downward trend.

According to Freddie Mac’s weekly Primary Mortgage Market Survey, the national average 30-year fixed rate mortgage rate fell 5 basis points to 3.66% this week. The rate is available to “prime” borrowers who are willing to pay, on average, 0.7 discount points plus a full set of closing costs.

30-year fixed rate mortgage rates are down in seven of the last eight weeks but, depending where you live, the mortgage rates made available to you will vary. The Freddie Mac survey notes that mortgage rates vary by region.

For example, mortgage applicants in the West Region received the lowest rates from lenders, on average, but also paid the highest number of discount points. Discount points are a specific type of closing cost where 1 discount point is a fee equal to one percent of your loan size.

Average mortgage rates in the five U.S. regions, as tracked by Freddie Mac :

  • Northeast Region : 3.70% with 0.7 discount points
  • West Region : 3.62% with 0.8 discount points
  • Southeast Region : 3.68% with 0.7 discount points
  • North Central Region : 3.65% with 0.7 discount points
  • Southwest Region : 3.68% with 0.7 discount points

Nationally, one year ago, the average 30-year fixed rate mortgage rate was 4.50%. Today, it’s 3.66%. This 84 basis points difference yields a monthly savings of $49 per $100,000 borrowed at today’s rates, or $588 per year.

A $400,000 mortgage would save $2,352 annually at today’s mortgage rates as compared to June 2011.

The 15-year fixed rate mortgage rate is also low, averaging 2.95% nationwide with 0.6 discount points. This is the second-lowest reading in recorded history. However, when the 15-year fixed averaged 2.94%, banks required an average of 0.7 discount points to get it. One could argue that this week’s average rate-and-points combination is actually a better “deal” because closing costs are lower.

Mortgage rates continue to break new lows so, if you’re eligible to refinance, the timing may be right to explore your mortgage options. Similarly, if you’re in the market to buy a home, today’s low rates will help to keep your home affordability high.

Talk to your loan officer about capitalizing on the lowest rates of all-time. Rates in Minneapolis may not rise starting next week, but when they do rise, their expected to rise quickly. Minnesota Real Estate Properties

Filed Under: Mortgage Rates Tagged With: Discount Points, Freddie Mac, PMMS

  • « Previous Page
  • 1
  • …
  • 959
  • 960
  • 961
  • 962
  • 963
  • …
  • 1133
  • Next Page »

Connect with Me!

Let’s Keep In Touch!

  • This field is for validation purposes and should be left unchanged.

Quick Links

  • About Me
  • Accessibility Statement
  • Blog
  • Contact

Looking For Something?

Categories

Copyright © 2025 · Powered by MySMARTblog

Copyright © 2025 · Genesis Sample Theme on Genesis Framework · WordPress · Log in